

Most UCaaS shortlists are built on licensing. Per-user or unlimited users, bundled minutes or usage-based billing, how much call routing and IVR logic you get before you need the next tier up. Those are real differences and they deserve the spreadsheet time they get. Call quality, on the other hand, usually earns one line in the RFP (“HD voice: yes”) and a test call from the sales engineer’s laptop on the office Wi-Fi, which sounds fine, because that kind of call nearly always does.
I spend most of my working time on voice quality testing, and the pattern barely changes from one company to the next. Nobody is asked to measure call quality while the contract is being negotiated. Somebody is asked to measure it about three months after go-live, usually by a sales director who has just had a bad call with an important customer.
Then the rollout reaches the people who actually spend their day on the phone. The support team in the branch office whose internet line gets saturated by the 9 a.m. cloud backup. The warehouse staff on the mobile app, walking between racking that eats signal. The account managers on the road who have every call forwarded to their mobile. Complaints arrive as “it sounds robotic” and “people keep asking me to repeat myself”, and nobody can tell whether the problem is the platform, the network, the headset or the carrier.
Mean Opinion Score (MOS) testing is how you turn those complaints into something you can measure, compare between vendors and fix. But only if you know which MOS you are looking at, because “MOS” covers several quite different measurements that happen to share a scale.
What a MOS score actually is
The original MOS is a panel of people. Under ITU-T P.800, listeners hear speech samples and rate each one on a five-point scale (5 excellent, 4 good, 3 fair, 2 poor, 1 bad). The mean of their ratings is the Mean Opinion Score. It’s slow and expensive, and no enterprise runs one to check their phone system.
Everything you will actually meet is a model that predicts what such a panel would have said. There are two broad families, and the difference between them matters more than anything else in this article.
Perceptual (intrusive) models play a known reference speech recording into one end of the call, capture what comes out of the other end, and compare the two signals using a model of human hearing. The current standard is POLQA, ITU-T P.863, first approved in 2011 and revised since. Its predecessor PESQ (P.862, 2001) still turns up in older tools. Because these models listen to the actual audio, they catch everything that damages it: codec artefacts, packet loss concealment, clipping, transcoding at a gateway, aggressive noise suppression, a level that is far too low.
Parametric (network-based) models never hear the audio. They take network and codec parameters (delay, packet loss, jitter, which codec is in use) and estimate what the call probably sounded like. The reference here is the E-model, ITU-T G.107, which produces a rating factor R between 0 and 100 that converts to a MOS. Most UCaaS admin consoles, call quality dashboards and network monitoring tools that show a per-call MOS are doing something along these lines, since it can be computed for every call from RTCP statistics without touching the audio.
The ITU even has labels to tell them apart (MOS-LQO for a perceptual model like POLQA, MOS-CQE for an E-model estimate). Vendors rarely print them. Ask.
| Perceptual (POLQA, PESQ) | Parametric (E-model style) | |
| What it needs | A test call with a reference recording at both ends | Network and codec statistics from real calls |
| What it sees | The actual audio, including device, codec and gateway effects | Delay, loss, jitter and codec type only |
| Coverage | Only the calls you place as tests | Every call on the platform |
| Typical use | Vendor bake-offs, acceptance testing, troubleshooting a specific path | Ongoing monitoring, trend alerts, finding bad sites |
| Main blind spot | Sampling: it measures your test calls, not your users’ calls | Anything that damages audio without showing up in packet statistics |
Neither is better. They answer different questions, and a sensible test programme uses both.
Why two “4.0” scores are not the same number
This is where most of the confusion in UCaaS evaluations comes from. The 1-to-5 scale looks universal. It isn’t.
The E-model’s default narrowband connection with G.711 and no impairments has R = 93.2, which converts to a MOS of about 4.41. That is the ceiling for that codec on that scale. A network-estimated score can’t go higher however good the network is.
POLQA has two operating modes with different ceilings. According to the POLQA Coalition’s own white paper and Rohde & Schwarz’s application note on the method, scores saturate at 4.5 in narrowband mode and 4.75 in super-wideband mode. The same white paper gives typical values that make the point better than any explanation: G.711, the codec behind traditional toll quality, scores roughly 4.3 on the narrowband scale but about 3.5 on the super-wideband scale. AMR-WB at 12.65 kbit/s, which is the HD voice codec on a lot of mobile networks, sits around 3.8 on the super-wideband scale.
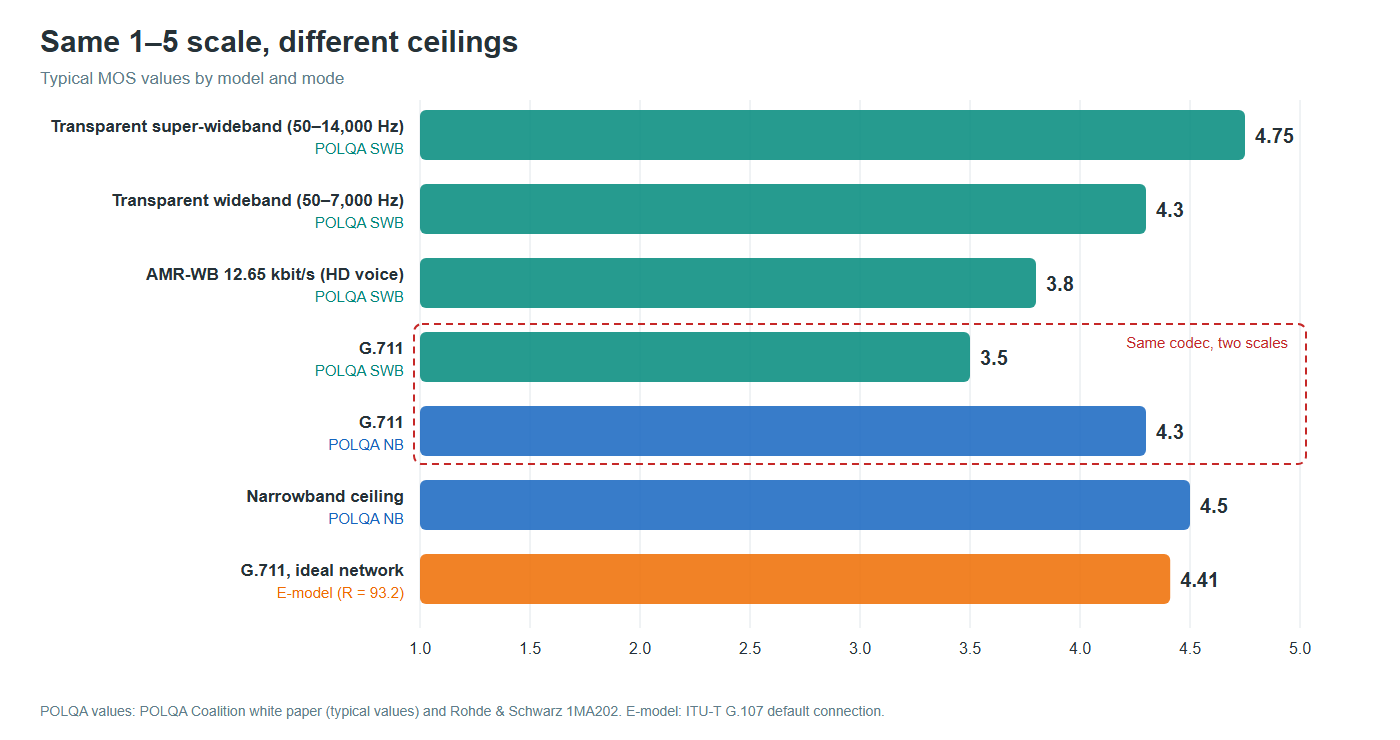
The same codec scores differently depending on the model and the mode. Always record which one produced the number.
So a vendor quoting “average MOS 4.3” and another quoting “average MOS 3.8” may be describing exactly the same audio. Or the 3.8 might be the better platform, measured on a harder scale. When someone sends me a MOS figure, my first reply is always a question about where it came from, and it’s surprising how often nobody knows. Before comparing any two numbers, get four facts written next to each of them: which model (E-model estimate, PESQ, POLQA), which mode (narrowband, wideband, super-wideband), which codec the call actually negotiated, and where the measurement was taken.
Reading the network-estimated MOS in your UCaaS console
The per-call MOS in an admin dashboard is useful, as long as you treat it as an estimate driven by network statistics. ITU-T G.109 maps the E-model’s R factor to user satisfaction bands, and converting those bands with the standard G.107 formula gives the MOS thresholds most people half-remember:
| R factor | Approx. MOS | G.109 user satisfaction |
| 90–100 | 4.34 and above | Very satisfied |
| 80–90 | 4.03–4.34 | Satisfied |
| 70–80 | 3.60–4.03 | Some users dissatisfied |
| 60–70 | 3.10–3.60 | Many users dissatisfied |
| 50–60 | 2.58–3.10 | Nearly all users dissatisfied |
The model also shows what actually moves the score. Delay costs very little until roughly 150 to 180 ms one way, then a lot. Packet loss costs you from the first percent. And the codec sets the ceiling: a G.711 call with 1 % loss still estimates above 4.2 at 150 ms, while G.729A starts at about 4.06 on a clean, short path and slips into “some users dissatisfied” much sooner. (These figures use the widely cited Cole and Rosenbluth simplification of the E-model.) If you want the network side of this in more depth, there is a good explainer on this site about latency and jitter in VoIP calls and the thresholds that matter for each.
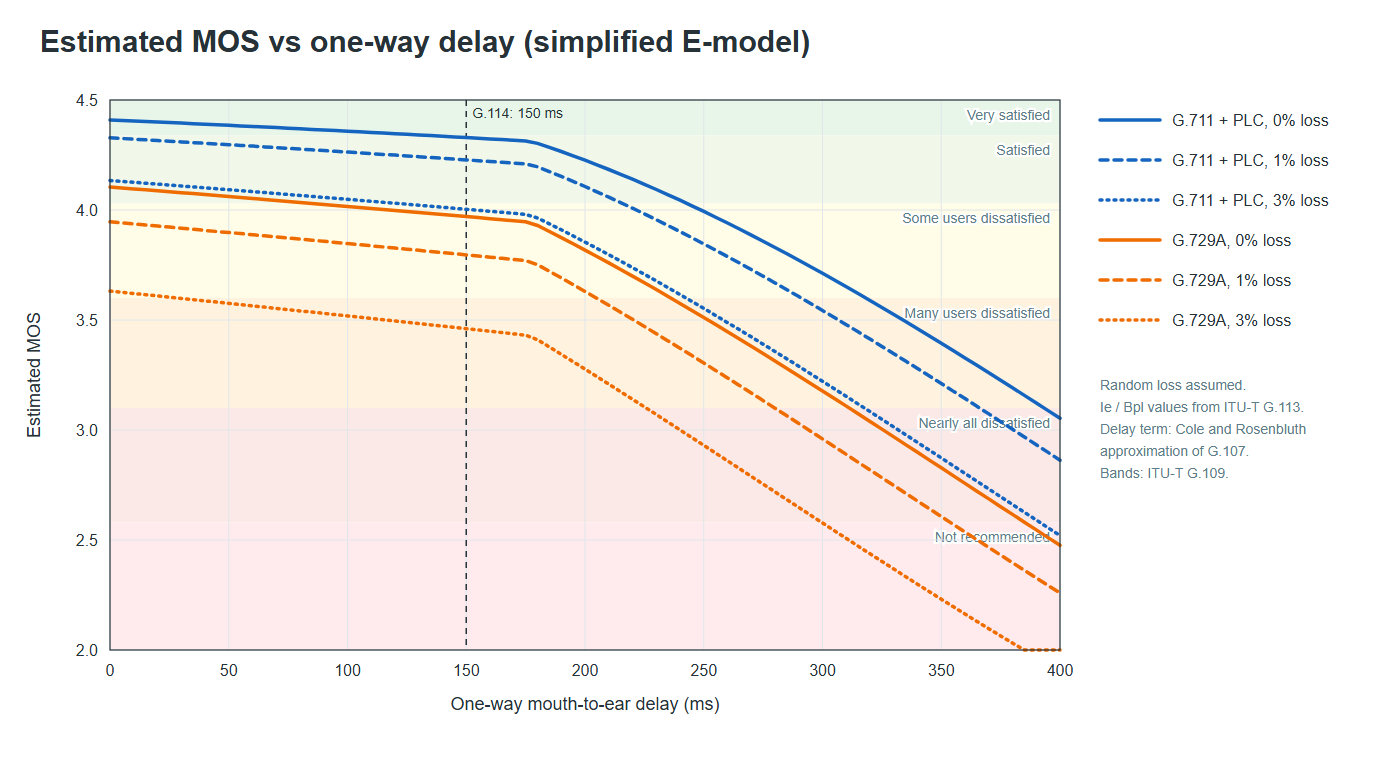
Estimated MOS against one-way delay (simplified E-model). Delay barely matters until about 150–180 ms; loss costs you from the first percent.
Two cautions. First, the E-model assumes random loss. Real loss on a congested Wi-Fi link or a saturated uplink tends to arrive in bursts, which sounds worse than the same percentage spread evenly, and some estimators handle bursts better than others. Second, a good estimated score only means the network delivered the packets. It says nothing about a cheap headset, a laptop microphone two metres away, or a gateway transcoding to a lower-bitrate codec on the way to the PSTN.
Microsoft is refreshingly honest about this in its documentation for the Teams Call Quality Dashboard. A stream is classified as poor if any one of several thresholds is breached (for audio: round trip over 500 ms, packet loss over 10 %, jitter over 30 ms, among others), and Microsoft notes that a poor classification doesn’t necessarily mean the user perceived a problem, because the media stack can conceal a fair amount of degradation. That’s the right way to use network-based scores: as a flag that tells you where to look, not as a verdict.
Map the call path before you measure anything
A UCaaS call crosses more networks than most evaluation plans account for. Roughly:
- The device: handset, headset, softphone, mobile app, and its audio processing.
- The local network: LAN switching, Wi-Fi, QoS markings that may or may not be honoured.
- The access and WAN: the ISP line, SD-WAN, VPN or security service edge that voice traffic may be hairpinned through.
- The provider’s media edge: the UCaaS data centre or point of presence the call lands on.
- The provider’s interconnect: SIP trunks to the carriers that handle PSTN and mobile calls.
- The far end: another softphone, a landline, or a mobile phone on a cellular network.
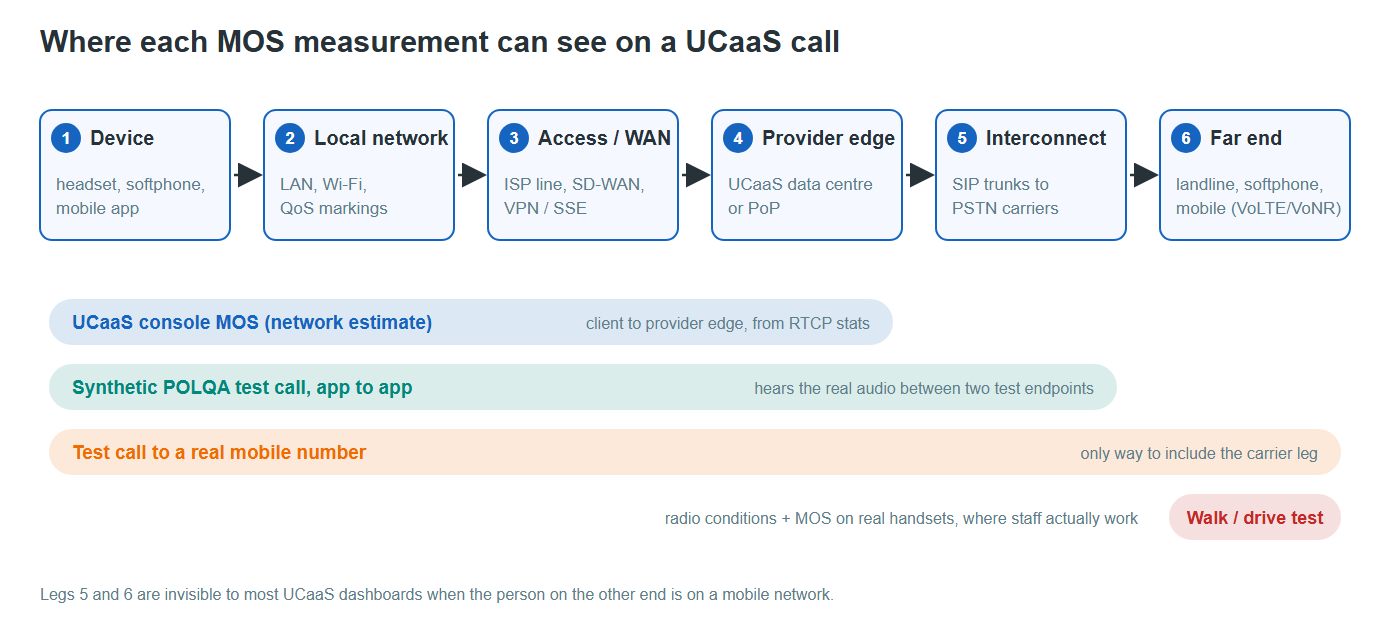
One call, six legs. Each type of MOS measurement sees some of them and is blind to the rest.
A test call between two softphones in the same office exercises legs 1 to 4 and back. A network-estimated MOS from the UCaaS console sees the RTP stream between the client and the provider’s edge. Neither tells you anything about leg 5 and 6 when the person on the other end is a customer on a mobile phone, and for a lot of businesses that is the call that matters most.
Write down which legs your highest-value calls actually cross before designing any tests. A contact centre talking mostly to consumers on mobiles has a very different risk profile from a professional services firm whose calls are mostly internal Teams-to-Teams.
Building a MOS test plan for UCaaS selection
If you are choosing between two or three UCaaS platforms, or migrating from an on-premises PBX, a structured pilot is worth a couple of weeks of effort. A workable sequence:
Pick sites and personas, not just offices. One headquarters seat on wired Ethernet, one busy branch on its normal internet line, one home worker on consumer broadband, one mobile user. These four cover most of what can go wrong.
Place synthetic test calls on a schedule. Use a perceptual test tool (POLQA where you can) to place calls between fixed test endpoints at intervals through the whole business day. A test at 2 p.m. will miss the backup job at 9 a.m. and the video-heavy all-hands at 4 p.m. Test both directions, because uplink and downlink problems are rarely symmetrical.
Capture the codec. Check what was negotiated in the SDP for each test call. A platform that falls back from Opus or G.722 to G.711 or G.729 on some routes will show a lower score that has nothing to do with network quality.
Include calls to and from real mobile numbers. Not only app-to-app. Call actual handsets on the carriers your customers and staff use, from the places they use them.
Report distributions, not averages. An average hides exactly the calls people complain about. A platform averaging 4.1 with 2 % of calls below 3.1 is a better choice than one averaging 4.2 with 9 % below 3.1, and the averages alone would tell you the opposite. Report the 5th percentile and the share of calls under your floor, per site.
Run every candidate on the same sites, at the same hours. Otherwise you are comparing your network on Tuesday with your network on Thursday.
For acceptance criteria, something along these lines is a reasonable starting point, to be adjusted for your codecs and call mix:
| Measurement | Starting threshold | Notes |
| Network-estimated MOS (E-model style), narrowband codecs | ≥ 4.0 on at least 95 % of calls per site | Investigate any site where the 5th percentile falls below 3.6 |
| POLQA super-wideband mode, wideband calls (Opus, G.722, AMR-WB) | ≥ 3.5 median, with no site under 3.0 at the 5th percentile | Remember transparent AMR-WB 12.65 is only about 3.8 on this scale |
| POLQA narrowband mode, PSTN and narrowband mobile legs | ≥ 3.8 median | G.711 tops out around 4.3 here |
| Call setup success | ≥ 99 % of test calls connected | A dropped or failed test call is a quality result too |
These are engineering thresholds, not industry standards, and the point of writing them down before the pilot is that nobody can move them afterwards to suit a preferred vendor.
The cellular leg: where UCaaS dashboards go blind
Mobile is where enterprise voice quality is hardest to see and easiest to get wrong, because “a mobile UCaaS call” can travel three quite different ways.
The UCaaS app over Wi-Fi. Behaves like any softphone, plus the usual Wi-Fi issues: roaming between access points, contention, and bursty loss. Your UCaaS dashboard sees it.
The UCaaS app over cellular data. The call is ordinary data to the mobile network. It rides a best-effort bearer and competes with everything else the phone and the cell are doing. LTE and 5G networks can be excellent for this, but there is no guaranteed voice treatment, and quality depends heavily on signal conditions and cell load at that spot. Your dashboard sees the RTP stream, but not why it degraded.
The native mobile call. When calls are forwarded or simultaneously rung to a mobile number, when a user falls back to the phone’s dialer, or when the platform integrates with an operator (Microsoft’s Teams Phone Mobile is one example of the model), the leg to the handset is a carrier voice call. On modern networks that means VoLTE or VoNR: voice over IMS on a dedicated bearer with guaranteed bit rate (QCI 1 on LTE), usually using AMR-WB or EVS. It often sounds better than the app over data. It is also completely invisible to the UCaaS console beyond the SIP trunk.
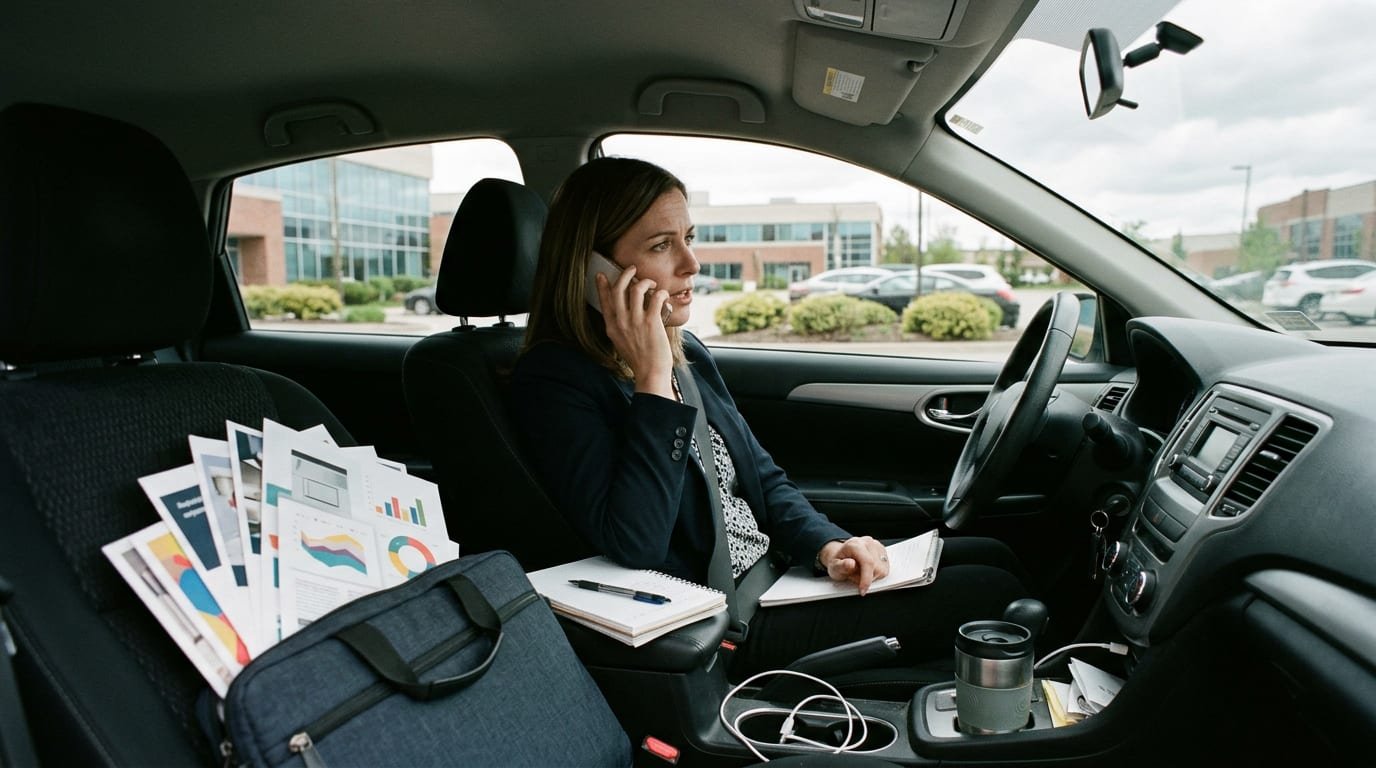
For a rep calling customers from the car park, the leg that decides call quality belongs to the mobile carrier, not the UCaaS platform.
For staff who live on that third path (field engineers, delivery drivers, clinicians on a hospital campus, warehouse supervisors), the only reliable way to know call quality is to measure it where they work, on the devices they carry. That means walk tests through the building and drive tests along the routes, placing scripted mobile-originated and mobile-terminated calls and logging radio conditions (signal strength and quality) next to each MOS result. This is the toolkit mobile operators use to verify their own voice service, and specialised VoLTE/VoNR MOS testing setups run perceptual scoring on real handsets while recording what the radio network was doing at each moment.

Drive tests cover routes, walk tests cover buildings. Mobile staff usually need both. Image: Dingli.
In my experience the walk test is where most of the surprises come from. Coverage maps from the carrier describe the street outside. They say very little about the back of a warehouse full of metal racking, a basement plant room, or the far end of a hospital corridor, and those are exactly the places where people take their calls.
The radio data is what makes the results actionable. A poor MOS with weak signal is a coverage problem, which points to a distributed antenna system, small cells or a different carrier. A poor MOS with strong signal points to the core network, an interconnect, or a codec mismatch. On 5G standalone networks that don’t yet support VoNR, voice falls back to LTE (EPS fallback), which typically adds to call setup time and is worth checking if users complain that calls are slow to connect rather than that they sound bad.
The results feed straight into decisions you would otherwise make by guesswork: whether to tell warehouse staff to use the app on Wi-Fi rather than ring through to their mobiles, whether a site needs in-building coverage before go-live, or whether an operator-integrated mobile option is worth its extra cost.
A worked example: three sites, two shortlisted platforms
To show how the pieces fit together, here is a typical evaluation. It’s a composite, and the scores are illustrative, chosen to be realistic for the codecs involved rather than taken from one specific project, but every situation in it is one I have seen more than once.
A distribution company with 120 staff is replacing an ageing on-premises PBX. It has a head office, a regional sales branch on a 100 Mbit/s business line, a warehouse, and 15 field sales reps who spend most of the day in the car. Two platforms are on the shortlist. Platform A is licensed per user. Platform B offers unlimited users with usage-based call charges, which looks cheaper on paper. In the sales demos, B’s dashboard showed an average MOS of 4.3 and A’s showed 4.1, so B also looked like the better-sounding option.
The team ran two weeks of synthetic POLQA calls (super-wideband mode) from all four locations on both platforms, at the same times of day, plus walk tests in the warehouse and test calls to the reps’ mobiles along their usual routes.
| Location and call type | Platform A, median / 5th percentile | Platform B, median / 5th percentile |
| Head office, wired, app to app | 4.1 / 3.9 | 4.0 / 3.8 |
| Sales branch, app to app, all day | 4.0 / 3.1 | 4.0 / 3.0 |
| Warehouse, mobile app over cellular data | 3.6 / 2.4 | 3.5 / 2.3 |
| Field reps, calls forwarded to their mobiles (VoLTE) | 3.7 / 3.4 | 3.3 / 3.0 |
Illustrative figures, POLQA super-wideband scale. Medians tell you about the typical call; the 5th percentile tells you about the calls people complain about.
Here is how the team read it.
The demo numbers meant nothing. B’s 4.3 was a narrowband network estimate and A’s 4.1 was a wideband perceptual score. Measured the same way at the same sites, the two platforms were close everywhere except on one leg.
The branch problem wasn’t a vendor problem. Both platforms had the same dip in the 5th percentile, and the bad calls all fell between 9:00 and 9:40, when the branch’s cloud backup saturated the uplink. Moving the backup window and adding an uplink QoS policy fixed it for either platform. Without a two-platform comparison, the team could easily have blamed whichever vendor they happened to pick.
The warehouse problem was coverage. Walk-test logs showed weak signal in two aisles of high racking, and nearly all the poor calls came from there. The fix was Wi-Fi coverage in those aisles so the app could stay off cellular data, not a different UCaaS provider.

Tall metal racking is one of the most common causes of poor mobile call quality indoors. A walk test with signal logging shows exactly which aisles are affected.
The field reps decided it. On B, calls forwarded to mobiles left the platform as narrowband G.711 at the carrier interconnect, so they couldn’t sound better than narrowband on the mobile side either, however good the VoLTE leg was. A kept the call wideband end to end on the reps’ carrier. For a team that sells over the phone all day, that difference mattered more than the licence saving, especially once the reps’ outbound minutes were priced on B’s usage-based plan.
The company chose A, fixed the branch backup window and the warehouse Wi-Fi before go-live, and kept the test schedule running at a lower frequency as a baseline. None of those decisions needed a MOS score taken to two decimal places. What they needed was the same measurement taken the same way across platforms, sites and call types.
After go-live: keeping the score honest
A pilot gives you a baseline. Keep it.

Watch the share of calls under your floor, per site, rather than the average score.
- Track percentiles per site. Set alerts on the share of calls below your floor, not on the average, and look at the trend weekly.
- Re-run perceptual tests after changes. New SD-WAN policies, a firewall or security service edge rollout, a Wi-Fi refresh, a carrier change, or the provider moving you to a different data centre region. Each of these has quietly broken voice quality somewhere.
- Use post-call ratings. Many UCaaS platforms can ask a sample of users to rate the call. That is genuine subjective data, the thing every other MOS is trying to predict, and it’s a useful check on whether your models agree with your users.
- Correlate tickets with scores. When a complaint comes in, pull the network-estimated MOS for that call. If it was fine, the problem is probably the device, the far end or the cellular leg, and that tells you which test to run next.
Limits and trade-offs
MOS testing isn’t free and it isn’t always necessary.
POLQA is a licensed algorithm, so the test tools that implement it cost real money. Synthetic test calls consume minutes, and on usage-based plans those minutes are billed like any others, so a schedule of calls every fifteen minutes across ten sites for two weeks is worth costing before you start. Test endpoints are not real users: a POLQA score measured between two test probes won’t capture a bad headset or a noisy open-plan office.
For a single-site business of twenty people on a decent fibre line, the built-in dashboard, a readiness test and a few deliberate test calls to mobiles are probably enough. The structured approach earns its keep when you have multiple sites, remote and mobile workers, customer-facing call volume, or a contract with quality commitments that you will one day need to hold a provider to.
FAQs
What is a good MOS score for VoIP calls?
On a narrowband, network-estimated scale, 4.0 or above is generally considered good, and around 4.3 to 4.4 is the practical ceiling for G.711. On POLQA’s super-wideband scale, numbers run lower: a clean wideband call may score around 3.8 to 4.3. Always check which scale a “good” number refers to.
Why does my UCaaS dashboard show a high MOS when users complain?
Most dashboards estimate MOS from network statistics. If packets arrive on time, the score is high, even if a headset, background noise, a transcoding gateway or a mobile carrier leg made the call sound poor. A perceptual test or a post-call rating will usually reveal the gap.
Is MOS the same as call quality?
It’s a prediction of perceived listening or conversational quality. It doesn’t capture call setup failures, dropped calls or echo in every model, so track those separately.
Can I test MOS without buying a dedicated tool?
You can read the network-estimated MOS your platform already provides and run free network readiness tests. Perceptual testing with POLQA or PESQ requires licensed software or a test service.
Does 5G improve UCaaS call quality?
It can, through lower latency and more capacity, but only where coverage is good and, for native calls, where the network supports VoNR. Over-the-top app calls on 5G data still get best-effort treatment. Measure at your own sites rather than assuming.
Final thoughts
UCaaS platforms are easier to compare on price and features than on how they sound, which is why call quality is so often discovered after the contract is signed. MOS testing closes that gap, as long as you know which MOS you are reading, measure the legs your important calls actually cross, including the mobile network, and judge vendors on their worst calls rather than their average ones. A couple of weeks of structured testing before you commit is cheap compared with a three-year contract on a platform your customers struggle to hear.